A tutorial explaining how to navigate the dashboard to display relevant information.
How to read dashboards and overview pages?
The following example shows step by step how to approach a dashboard view.
> Step 1
- In the Explore app, navigate to Citizen Science.
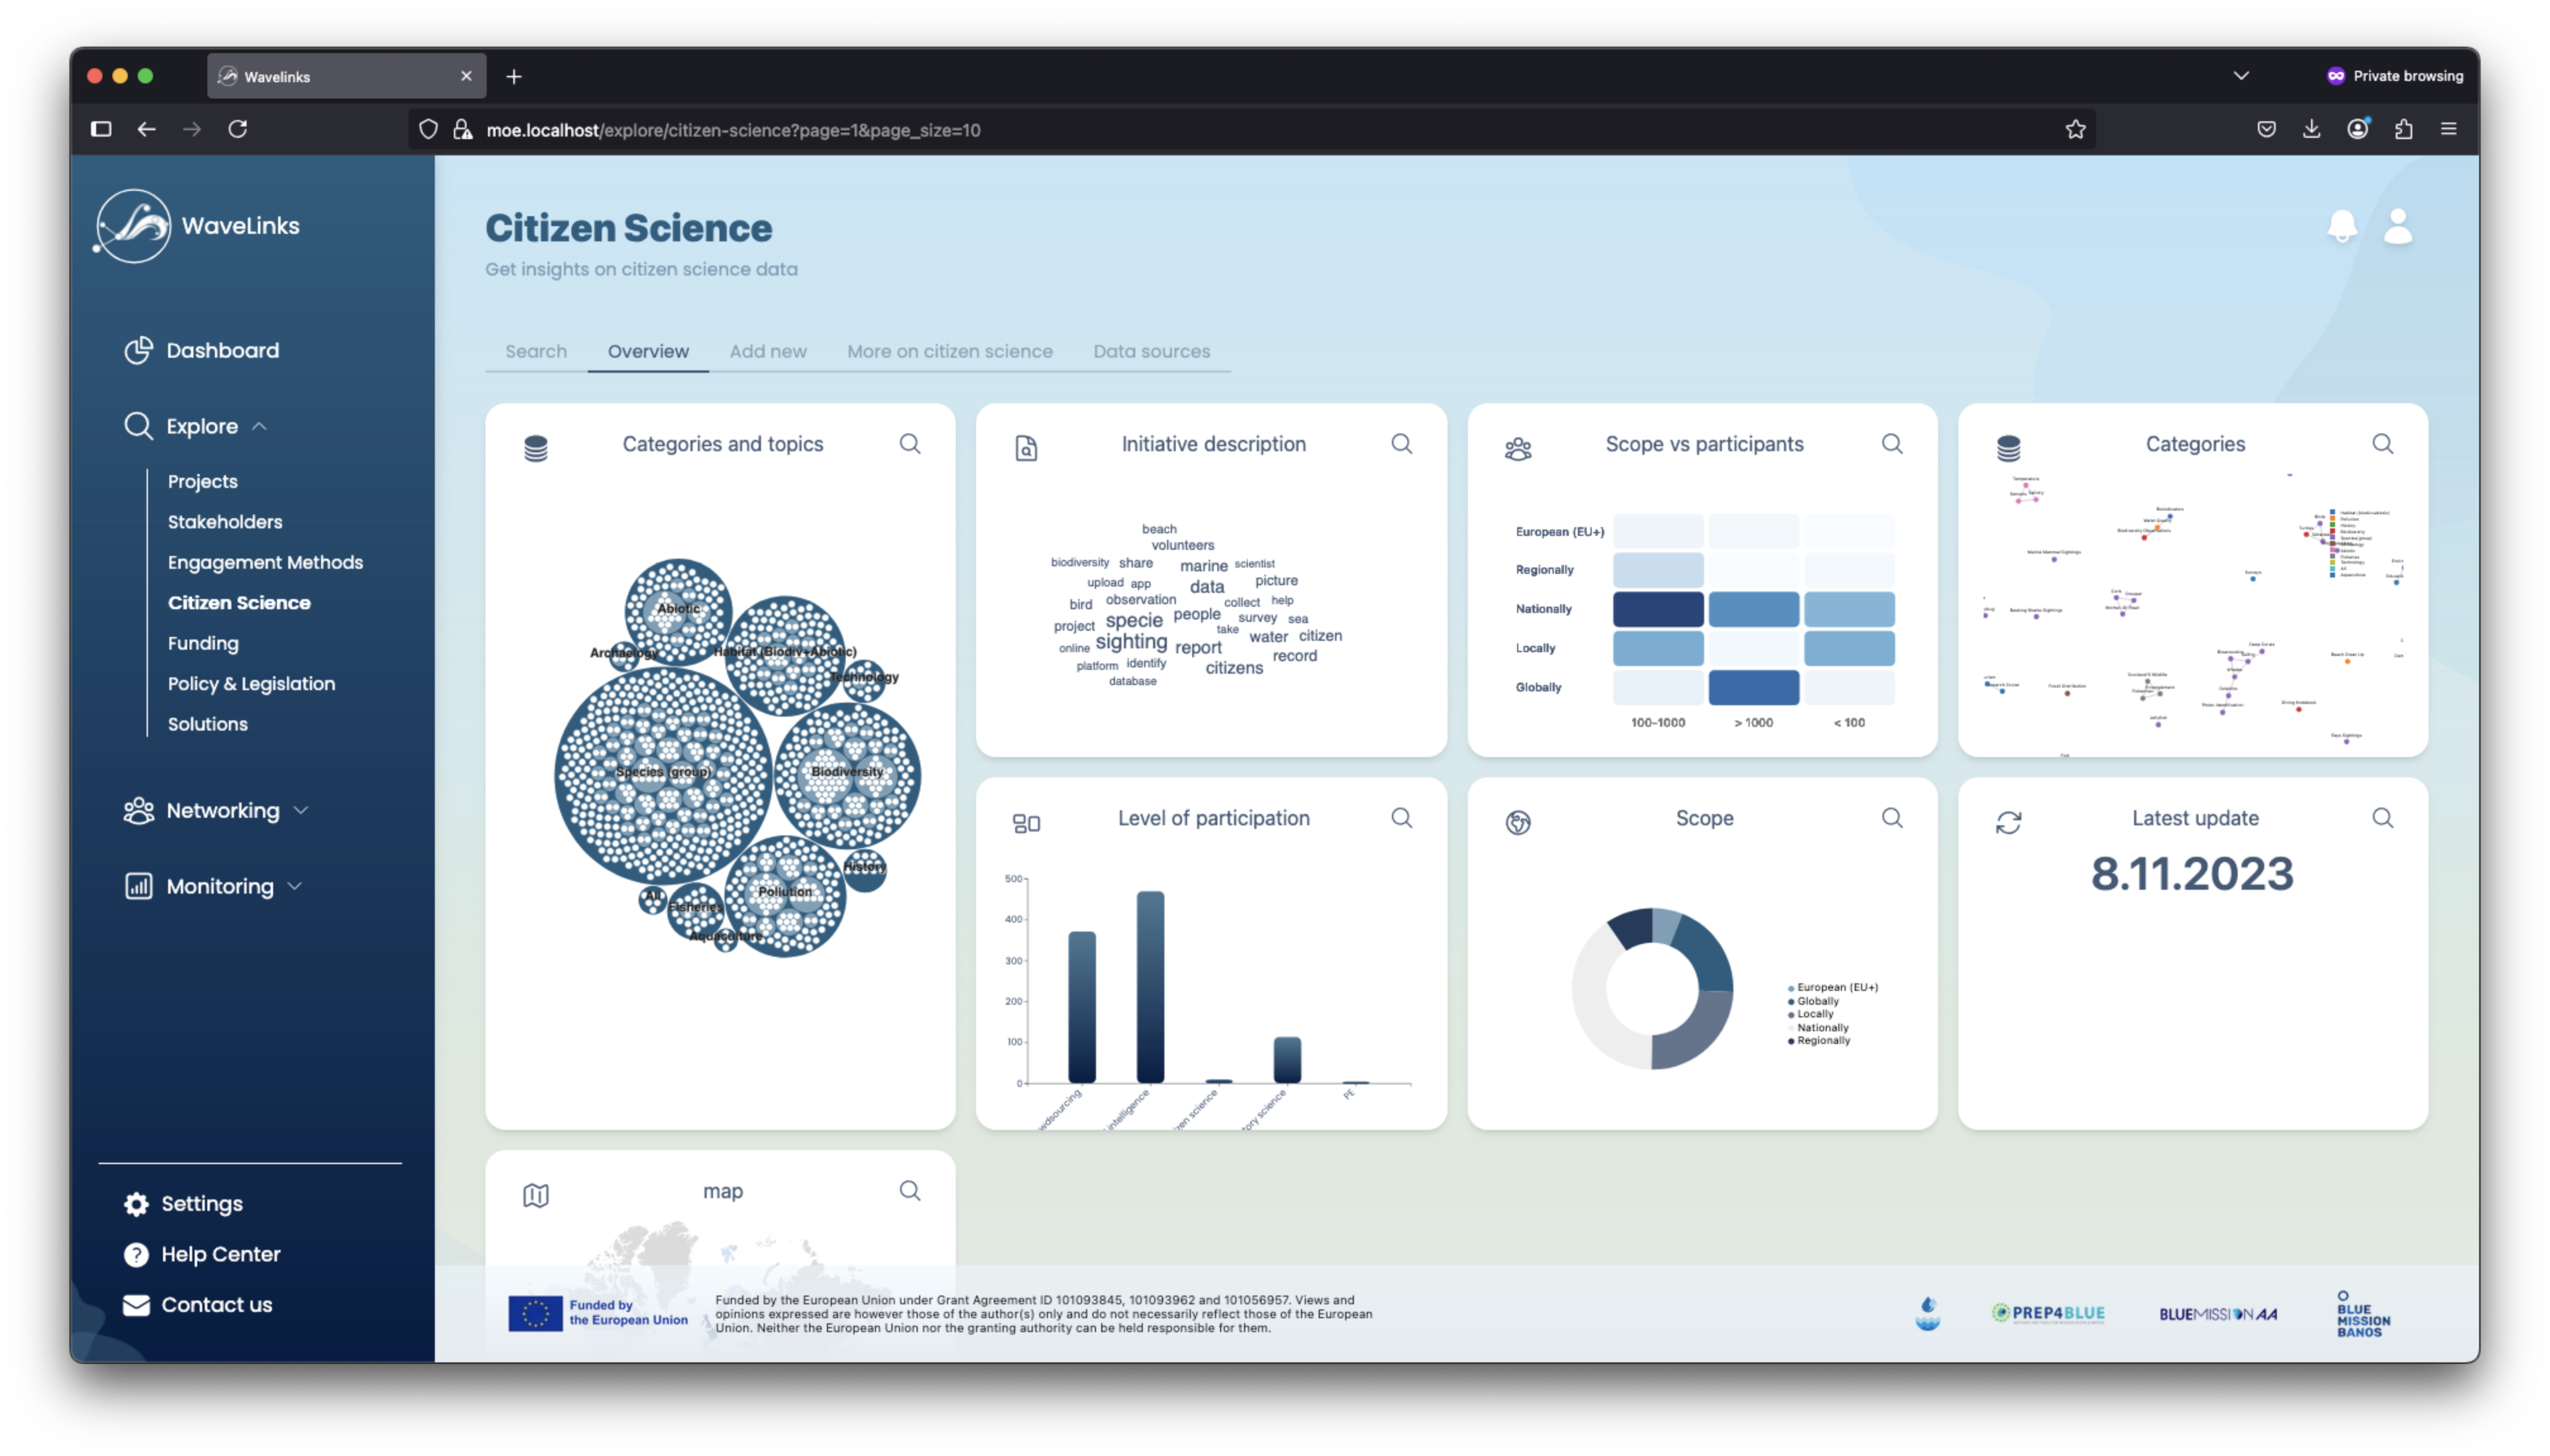
- On the Citizen Science page, click the Overview tab on the top of the page.
> Step 2
Familiarize yourself with the available tiles and graphs:
- Categories and topics: An interactive graph. You can view the topic names. Clicking the outer circles lets you zoom into that clicked category. Once you see numbered circles, these correspond to single instances; clicking of one of those navigates you to its details page where you can find all information that is stored on it in our database.
- Initiative description: Shows a wordcloud to capture the sense of the initiative.
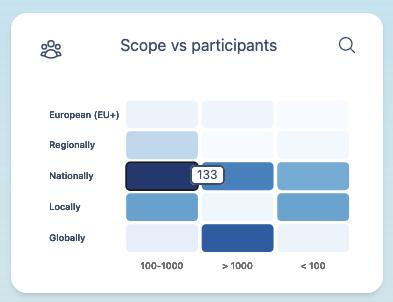
- Scope vs. participants: Shows the scope of the initiatives in terms. Example: 133 instances have 100-1000 participants in the national scope. Hovering over the graph show the exact numbers, otherwise, the darker the blue, the higher the number of instances in that category.
- Categories: A graph view of the different categories with there connections. Each circle in the visualisation belongs to a subcategory to the categories listed in the top right, indicated by squares. Connections between circles and squares are based on their colour. The lines between circles show connections.
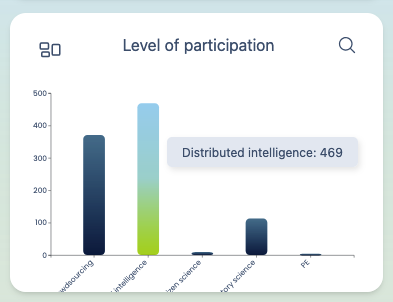
- Level of participation: A bar chart showing the number of participants per category, for example, "Distributed intelligence" has 469 participants. Hovering over the graph shows the exact numbers.
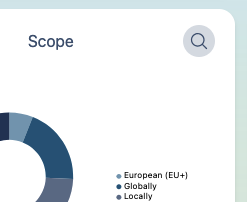
- Scope
- Latest update: Shows the date of the latest data update.
- Map: Shows the number of initiatives in the
Note that you can interact with the graphs by hovering over them and increase the view of a particular visualisation by clicking the magnifying glass at the top right of the dashboard tile.
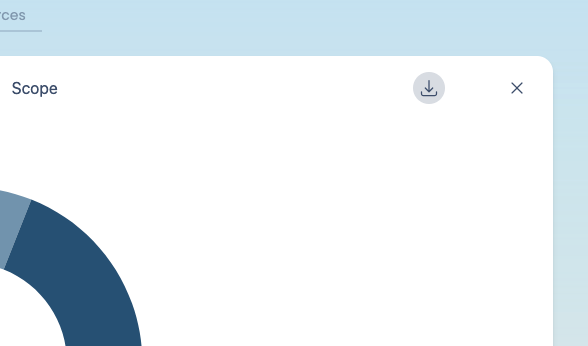
> Step 3: Download
Click on the magnifying glass icon on any of the tiles.
Here you find a download button that triggers a download of the corresponding plot as a
.pngfile.